1.配置文件(自动发现)
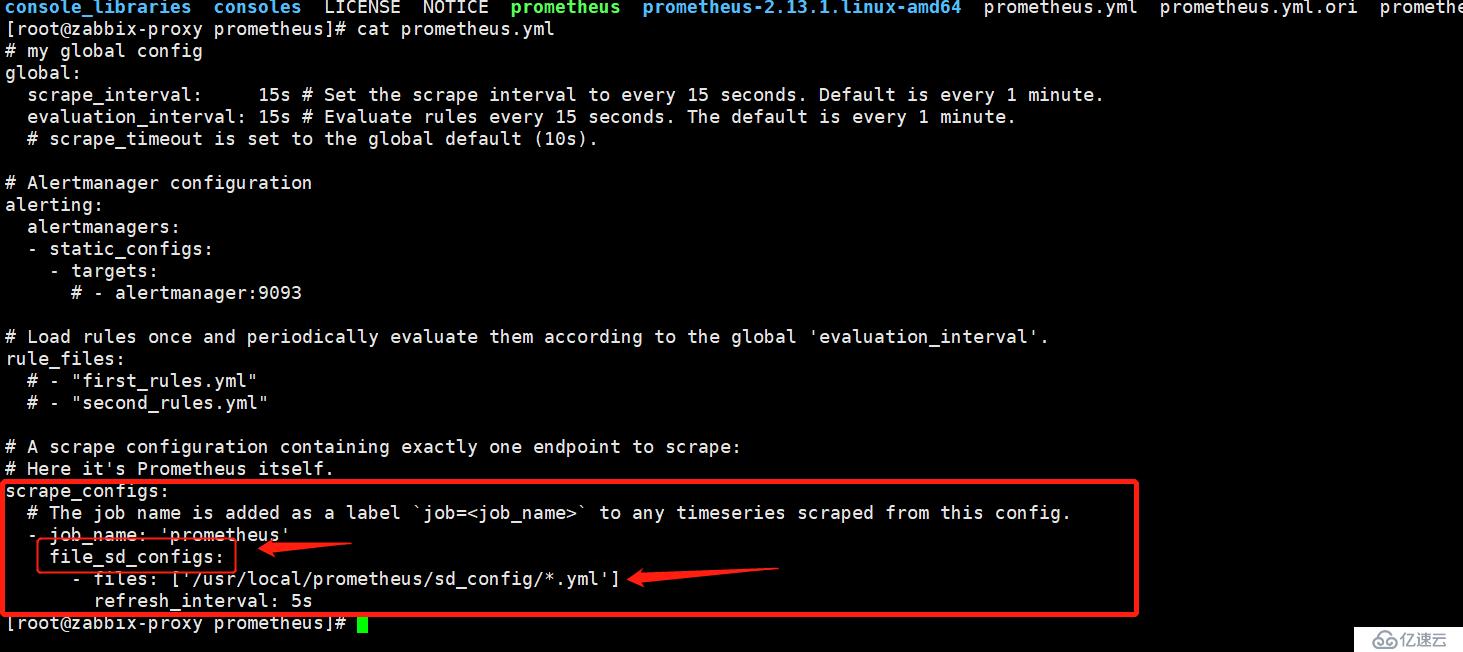
[root@zabbix-proxy prometheus]# cat prometheus.yml # my global config global: scrape_interval: 15s # Set the scrape interval to every 15 seconds. Default is every 1 minute. evaluation_interval: 15s # Evaluate rules every 15 seconds. The default is every 1 minute. # scrape_timeout is set to the global default (10s). # Alertmanager configuration alerting: alertmanagers: - static_configs: - targets: # - alertmanager:9093 # Load rules once and periodically evaluate them according to the global 'evaluation_interval'. rule_files: # - "first_rules.yml" # - "second_rules.yml" # A scrape configuration containing exactly one endpoint to scrape: # Here it's Prometheus itself. scrape_configs: # The job name is added as a label `job=<job_name>` to any timeseries scraped from this config. - job_name: 'prometheus' file_sd_configs: - files: ['/usr/local/prometheus/sd_config/*.yml'] refresh_interval: 5s [root@zabbix-proxy prometheus]#
2. prometheus 软加载配置文件
kill -hup pid3.prometheus 校验配置文件
[root@zabbix-proxy prometheus]# /usr/local/prometheus/promtool check config /usr/local/prometheus/prometheus.yml Checking /usr/local/prometheus/prometheus.yml SUCCESS: 0 rule files found [root@zabbix-proxy prometheus]#4.查看被软加载(自动发现)的配置文件
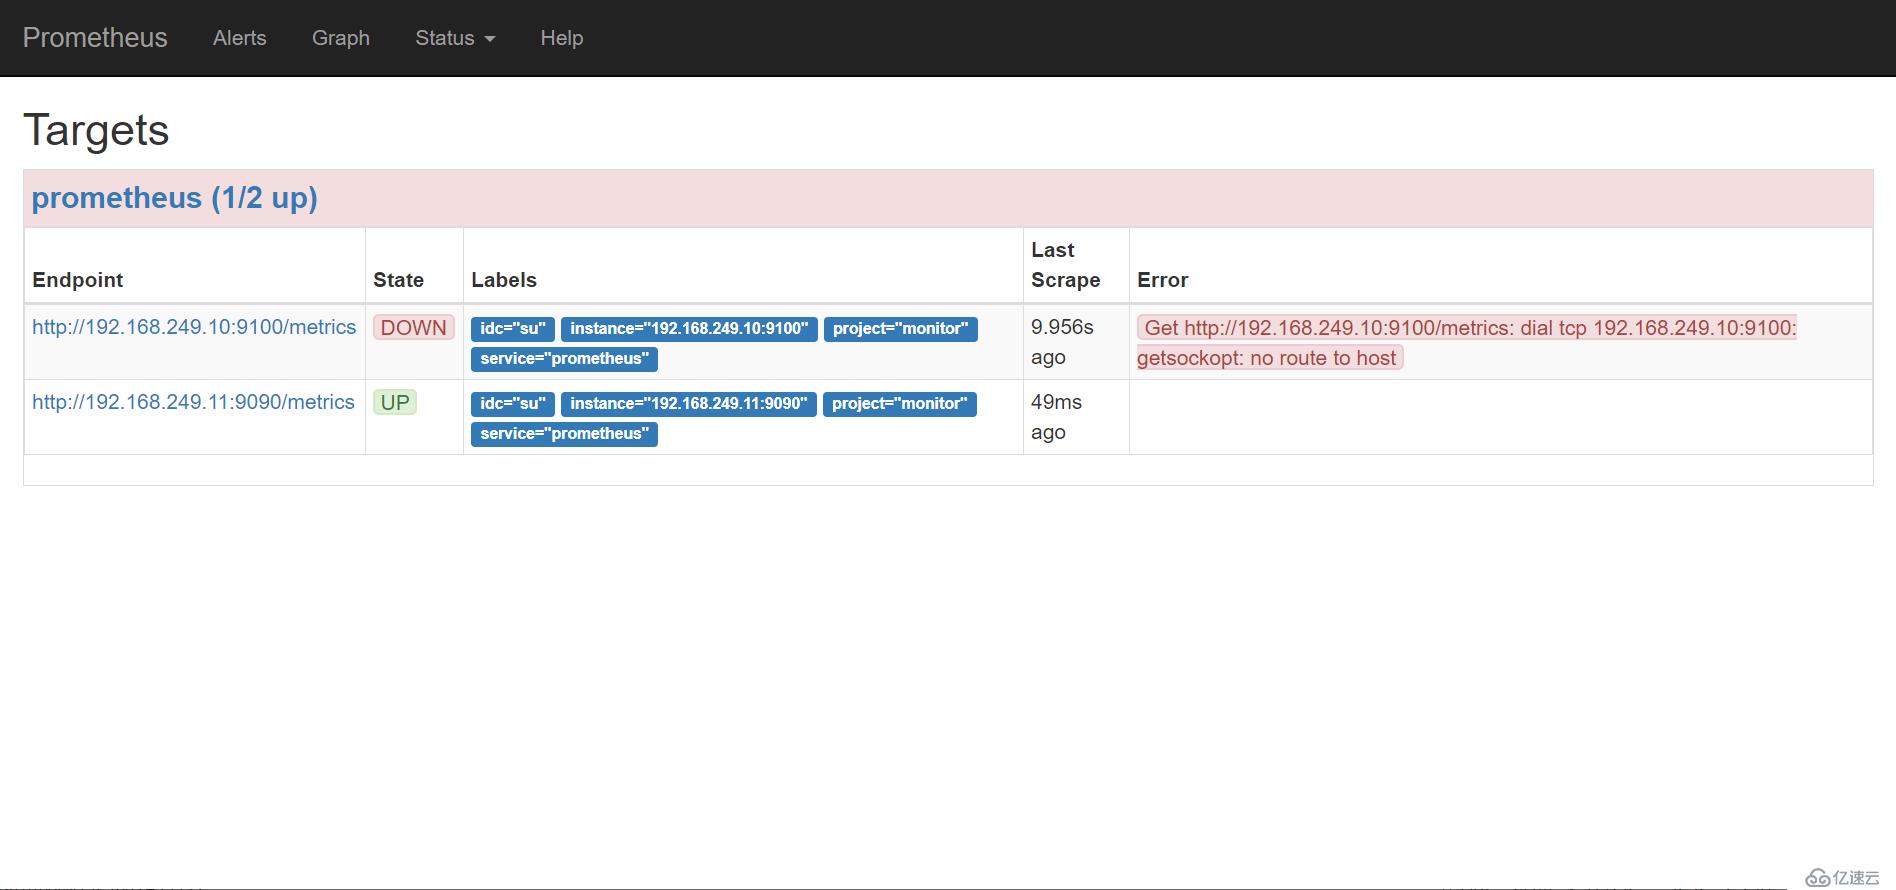
[root@zabbix-proxy sd_config]# pwd /usr/local/prometheus/sd_config [root@zabbix-proxy sd_config]# cat prometheus-server.yml - labels: service: prometheus idc: su project: monitor targets: - 192.168.249.11:9090 [root@zabbix-proxy sd_config]#5.同一类项目


郑重声明:本文版权归原作者所有,转载文章仅为传播更多信息之目的,如作者信息标记有误,请第一时间联系我们修改或删除,多谢。